I wrote up a simple little analysis on how smoothing data affects calculation of total elevation gain.
Those of you that use GPS devices, I was wondering how much you've tracked what the device reads compared to what hiking literature and/or topo calculated estimates for a hike? I find mind tends to overestimate a bit, but not terribly much. Maybe 500 ft for a long hike.
GPS Discussion #2 Elevation Gain
-
mattmaxon
- Posts: 1137
- Joined: Mon Mar 24, 2008 12:48 pm
Well it seems to me....
The device parameters need to be established.
If you are using the GPS elevation. There can be large errors, if you have a poor fix.
in the case of the Garmin "S" models the elevation is a barometric elevation. I "feel" this is more accurate than the topographic map.
Unless you are comparing the elevation to a known surveyed elevation you are going to get discrepancies.
You for the most part are not going to find many of these points in the mountains. How accurate they are is another question.
Some where established with survey grade barometric altimeters, how the heck they compensate for changes in pressure is a mystery to me.
More accurate are the surveyed points, recently a high precision GPS point has been appearing
Some of the topography is from the 1890's Errors are made on these maps, they are not the word of the lord god almighty
The GPS points are done with cm (yeah CM) survey grade GPS and post processing
Just experiment...
Find 2 known points in the urban landscape and move between both.
Then check the difference in elevation with your Garmin "S" model I 'm confident you'll find the difference to be quite close .
But we're just talking elevation difference here not the actual position
Also what is the stated accuracy of the gauge? 15%, 10%, 5%, 2% etc...
Comparing your measurements to someone else without knowing how the measurement was taken is impossible
It's like having an apple and an orange and saying they are not the same, well yeah
Matt
-
Rumpled
- Posts: 271
- Joined: Mon Feb 25, 2008 10:57 pm
Good analysis. On your last graph, I'd go for at least 20 points. I would think that as you approach infinity you get to the actual elevation.
I have a Magellan Meridian Platinum and it has a barometric altimeter.
All of this is mostly conjecture on my part, my "seat of the pants" observations.
I find that it is generally accurate with regards to elevation. A lot depends, I believe; upon how accurate my starting pressure is.
I sometimes use my weather radio to calibrate before use, but not always.
I often experience errors on the unit. A couple of weeks ago I was in Laughlin and my unit kept reporting ~2400 feet elevation when it really about 520.
I didn't have a weather report and just left it. After about an hour, it resolved. The track of my hike shows that I jumped off of a 2000 foot cliff.
When I hiked San Jacinto; for about an hour my elevation was about 1000 feet high. It was reporting about 10500 when I was in the low 9's.
I have Magellan's topo maps loaded in the unit and often move my cursor off my track to the just next to it on the map. This will show me map elevation. (with whatever accuracy/lack thereof it has)
This usually reports fairly close. A few hundred feet at most; usually probably 100-150 feet. Certainly good enough for most use.
Given time in one spot, it seems to get to a good average.
I set my unit to a track algorithm that is their "smart" track. It doesn't use a set time or distance interval; it sets more points around a curve and less along the straights.
This minimizes data points while still trying to get the worthwhile data.
I think this also contributes to errors in distance and elevation.
I think my unit has a real problem integrating slope into distance calculations. If I were to go up a steep slope, I think it really only captures the horizontal distance component.
I wish I could select my display between three different elevations, mostly as verification.
I'd like to be able to use barometric elevation, topo map elevation; and a calculated triangulated elevation from satellite observation.
-
AlanK

- Posts: 1069
- Joined: Thu Sep 27, 2007 9:28 pm
People tend to get very confused by GPS units that have a barometric altimeter. The displayed elevation is not determined solely from the barometric pressure.
GPS can provide accurate elevation readings, but one has to be in one spot for a while to allow averaging of readings at a single elevation. Individual determinations have a sizable error -- much worse than the horizontal error of the GPS unit.
Barometric altimeters work only if calibrated to a known elevation because barometric pressure at any point changes with the weather.
I know that Garmin combines GPS and barometric altimeter readings. GPS data are used to calibrate the altimeter and barometric data are used to smooth the GPS data acquired as one moves around. The GPS data are used to calibrate the barometric altimeter constantly to compensate for barometric pressure changes due to the weather. I am not familiar with the algorithm that Garmin uses but I am impressed by the results.
-
JMunaretto
- Posts: 370
- Joined: Thu Feb 07, 2008 11:03 am
Well my final point kind of touches on this, you need to know what the person used to determine their elevation #'s, as each method will give different results. But I would not say it's comparing apples and oranges - both are trying to estimate the same thing - elevation gain.mattmaxon wrote: Comparing your measurements to someone else without knowing how the measurement was taken is impossible
It's like having an apple and an orange and saying they are not the same, well yeah
The graphs I showed have properties that are consistent with any GPS device, whether it determines altitude using only GPS, altimeter, or a combination: When estimating total elevation gain, different smoothing values will give different results.
You can see that when you have no smoothing, the values get ridiculously high. It is sort of like fractal patterns - Alan alluded to this before - but this is based on the fact that any device is going to have error, and if you sample more frequently, the error is going to accumulate.
Actually you don't want too many points. Look at the purple line in the second graph, which has 60 points. You are already losing too much information, if you use 1000 points, the elevation curve would not even distinguish between all the bumps between Harwood, Baldy, West Baldy, etc...it would be just one big hump.Rumpled wrote:Good analysis. On your last graph, I'd go for at least 20 points. I would think that as you approach infinity you get to the actual elevation.
With my model I use the altimeter mode, have not tried the GPS alone mode. I also have a separate barometric altimeter watch, and its values may vary up to 1,000 ft from the Garmin device. It makes sense of course that they are using GPS altitude coordinate to make sure the altimeter is not swaying due to weather changes, but is it updated every second, minute? One wonders. And how much of these algorithms are applied only to the data they display as opposed to output. But yeah I agree the results are pretty good. Definitely better than with an altimeter alone.AlanK wrote: I know that Garmin combines GPS and barometric altimeter readings. GPS data are used to calibrate the altimeter and barometric data are used to smooth the GPS data acquired as one moves around. The GPS data are used to calibrate the barometric altimeter constantly to compensate for barometric pressure changes due to the weather. I am not familiar with the algorithm that Garmin uses but I am impressed by the results.
And that's at an individual point, think of the calculation of total gain with that much error!DamOTclese wrote: In the canyons I find GOS reception to be off as much as 50 feet depending upon oblique angle to whatever satelites are visible and topological maps are overwhelmingly more accurate since many are based upon USGS benchmarkings.
Well I assume Garmin also incorporates their time-dependent accuracy values into their algorithms. In a canyon, the GPS pick up fewer satellites and state the error is higher as compared to on a peak where the error is down to 10-12 ft. So they probably filter differently based on this.
-
AlanK
- Posts: 1069
- Joined: Thu Sep 27, 2007 9:28 pm
The averaging trick works well on flat ground or a linear slope.JMunaretto wrote:I wrote up a simple little analysis on how smoothing data affects calculation of total elevation gain.
As you move along flat ground, points in front of you and behind you (which you later average with your current elevation) have the same elevation and you are simply averaging out the random error in the instrument.
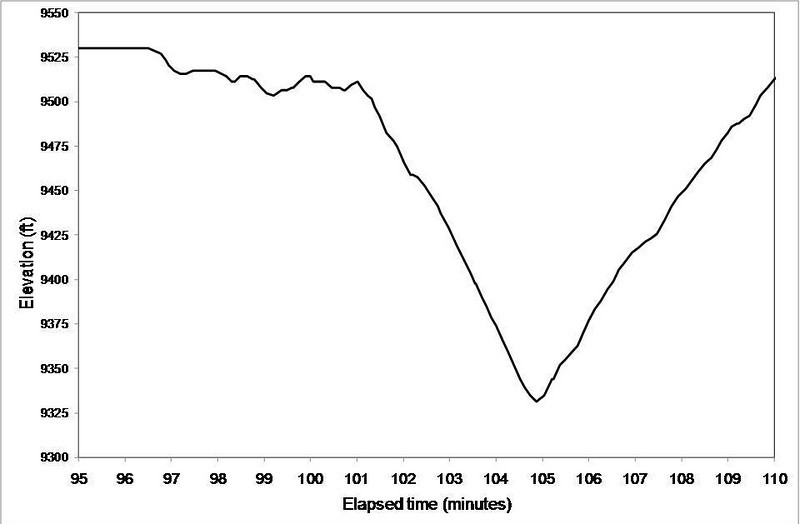
As you move up or down a constant slope, you incur a systematic errot. However, those systematic errors from in front of you and behind you cancel out if you move at a constant speed -- one point is too high and one is too low, but by the same amount. The random errors tend to cancel as before. You can see this in your example on the sloped sides of the saddle.
Near a minimum or maximum, you incur systematic errors that do not cancel. In your case of a minimum, points in front of you and behind you when you are near the bottom are both higher than your real elevation. Averaging them in will tend to move the curve upwards, exactly what you see. To get around this, you could do polynomial fits at each point, using some number of neighboring points. This is easy with something like Excel. I would not use a high-order polnnomial, but I'lll bet you do pretty well with a cubic polynomial and a dozen points on either side.
-
AlanK
- Posts: 1069
- Joined: Thu Sep 27, 2007 9:28 pm
I took the raw data from my Forerunner 305 GPS watch for my Register Ridge hike last Saturday. I plotted it up to see what various averaging games would do. The following plots afe for the entire hike and for the portion near Baldy-Harwood saddle.
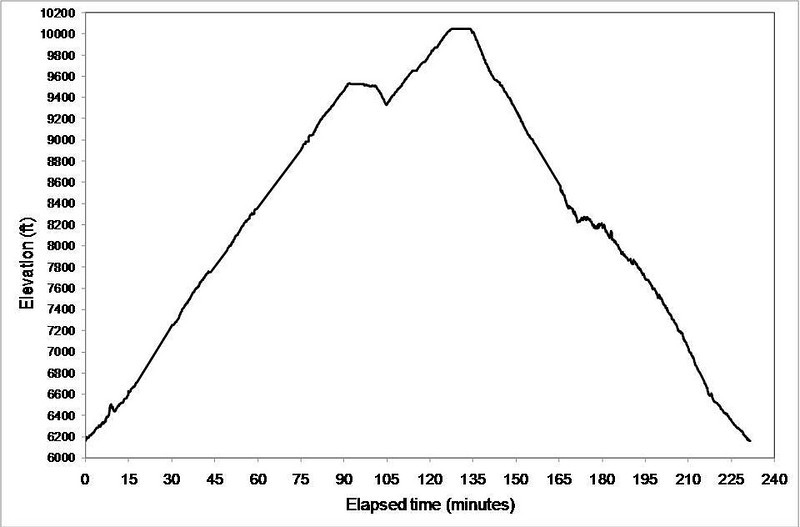
I liked the data as is, which is why I like that instrument so much. The average elapsed time between data points was 8.6 sec.
The elevation measured on the summit was 10047' -- the official measurement is 10064'.
P.S. The plots displayed just fine in Preview mode but do not show up when I look at the message with my browser later. Just in case, here is a link to my pictures for the hike. The graphs are at the end.
-
JMunaretto
- Posts: 370
- Joined: Thu Feb 07, 2008 11:03 am
Yup I think I get about the same tightness in fit on my curves using about 10 points on a side.
Totally get the error thing, I've done at least a little bit of filtering to see the change in frequency content. Basically flat or linear has very low frequency content, so you can get away with a very low-pass filter for them, but at changes in slope, the frequency content is higher, so the filter cannot remove that frequency range or signal will be loss.
Of course I'm sure Alan already knows all this. He did go to Cornell.
-
AlanK
- Posts: 1069
- Joined: Thu Sep 27, 2007 9:28 pm
It's where I learned about snow.JMunaretto wrote:Of course I'm sure Alan already knows all this. He did go to Cornell.